
How We Built a Business Intelligence Strategy That Works?

Why we started thinking about this
I work as a data analyst in our BI team. Every day our team writes SQL, builds dashboards in Looker Studio or Power BI, and connects data from Facebook, Google, TikTok, CRM systems and call tracking for different clients. So BI is not a theory for us. It is our normal working day.
And there is one message our team gets almost every week: “Why is the number in the dashboard different from what Facebook shows?” Sometimes the answer is simple, like a different time zone or attribution window. But sometimes the real answer is that nobody ever agreed what the number should mean.
We also saw the other side. A dashboard is ready, everyone says “wow”, and after two weeks nobody opens it. The data was correct, the charts were nice, but it did not answer the questions people actually had.
After some time we understood that in both cases the problem was not the tool and not the SQL. The problem was that there was no business intelligence strategy behind the work. In this post we want to share what we learned about building one, in simple words, from the point of view of the team that builds the reports, not from a consultant’s slide.
What is a business intelligence strategy, really?
It sounds like something big and complicated, but the idea is simple. A business intelligence strategy is a plan for how a company will use its data to make decisions. For us it comes down to five questions:
- Why do we need data? Which business goals should it support?
- What do we want to know? Which questions and KPIs really matter?
- Where is the data? Which systems hold it, and how do we connect them?
- Who is responsible? Who owns the data, who builds the reports, who uses them?
- How will we deliver it? Which tools, architecture and processes?
One thing we want to say clearly: a BI strategy is not buying Looker Studio, Power BI or Tableau. The tool is only the last layer, the part people see. Everything important happens before that: where the data comes from, how it is cleaned and combined, and how every KPI is defined.
We like to think about it like building a house. The data strategy is the foundation, the BI strategy is the plan of the house, and business intelligence implementation is the construction work. You can start building without a plan, but you will definitely rebuild some walls later.
Why business intelligence projects fail
From our experience, BI projects almost never fail because of technology. SQL works, the tools work. They fail because of people, definitions and data quality. Here are the problems we see most often.
- Starting with the tool, not with the question. Someone buys a BI platform, and then asks “so what should we put there?”. The result is a dashboard with fifty metrics that answers nobody’s question.
- Nobody agreed on the definitions. Marketing counts a lead one way, sales another way, and finance a third way. In our work this is the most common reason for the “why don’t the numbers match?” message. Is a lead every form submission, or only a unique person? Is a qualified lead someone with 3 stars or with 4? If this is not written down, every report will tell a different story.
- Bad data. This is the problem we know best. If the data is wrong, the dashboard is wrong too, just more beautiful. Duplicate leads, broken tracking, missing UTM parameters, a campaign named one way in the ads platform and another way in the CRM. Before building anything, you have to spend time cleaning. Nobody likes this part, but it is the most important one.
- Trying to do everything at once. “Let’s build one source of truth for the whole company” sounds great. In practice it takes too long, and people lose interest before they see any result.
- No owner on the business side. If BI is seen only as an analyst’s or IT task, nobody feels responsible for actually using the reports. Every dashboard needs a person who makes decisions with it.
- People don’t use it. The dashboard is ready, but people still export data to Excel or write to the analyst to ask for one number. Usually this means the report is too complex, too slow, or not built around how they really work.
- Nobody maintains it. Data sources change all the time. An ad platform updates its API, the CRM gets new fields, the team changes the naming of campaigns. Without monitoring, reports break quietly, and you find out only when a client asks why the numbers look strange.
A good business intelligence strategy is basically a plan to avoid these seven problems before the first chart is built.
How we build a business intelligence strategy, step by step
This is the order we follow, or wish we had followed from the beginning. It works for a small company and for a big one. Only the size changes, not the order.
Step 1: Start with the business goals
Before opening any database, we ask: what does the business want to achieve this year, in general? Lower the cost of a new customer? Get more qualified leads, not just more leads? Grow repeat purchases? Three to five goals are enough. Every report we build later should connect to one of them. If it doesn’t, it is a nice-to-have, not a priority.
Step 2: Find the decisions behind each goal
Goals alone don’t tell you what to build. Decisions do. So we ask people: what do you decide every week, and what do you need to see for that? A marketing manager who moves budget between channels every week needs cost per lead by channel, today and compared with last week. A CEO who looks at growth once a month needs revenue, margin and trends. Different decisions, different reports.
Step 3: Define every KPI and write it down
This is the step we would never skip again. For each KPI we write the formula, the data source, the filters, the time zone (and the data refresh should follow the same time zone, so the whole dashboard shows everything by one clock: Israel, New York, Georgia, Ukraine or Central European time), the currency and the attribution rule. For example: “Cost per qualified lead = ad spend ÷ unique leads rated 3 stars or higher, by the date the lead was created.” All definitions go into one shared KPI dictionary. This one document saves more time than any dashboard, because it ends most of the “why don’t the numbers match?” conversations.
Step 4: Check where the data lives
Next we make a list of all sources: ad platforms like Google Ads, Meta and TikTok, GA4, the CRM, call tracking, Shopify, and of course the Google Sheets with budgets and targets that every company has. For each source we note how we can get the data (API, connector, export), how fresh it is, who owns it, and what problems it has. This list shows the real size of the project, and it is usually bigger than people expect.

Step 5: Design the architecture
Now we decide how the data will move from the sources to the dashboards: where it is stored, where it is cleaned and joined, and where people will see it. We explain this part in detail in the next section, because we think it is where most mistakes happen.
Step 6: Decide who does what
In our team, the developer builds and maintains the data pipelines, and the BI analyst builds the data models, KPI logic and dashboards. On the client side there should be one person who owns each report and uses it to make decisions. Usually this is the Client Manager (CM). Add a few simple rules: who can change a KPI definition, who approves a new data source, and who can see what.
Step 7: Choose tools you can maintain
We don’t think you need the most expensive stack to start. A PostgreSQL database, scheduled pipelines and Looker Studio or Power BI are enough for many companies. You can move to a bigger cloud warehouse later if you really need it. The best tool is the one your team can actually support.
Step 8: Plan in small steps
Don’t plan one big launch. Plan small releases, where each one gives one useful report to one group of people. Start where the value is high and the data is already in good shape. We show what this looks like in the implementation section below.
Business intelligence architecture: how it looks in our daily work
Business intelligence architecture sounds very technical, but for us it is just the road the data travels, from the place where it is born to the screen of the person who makes a decision. Each part of the road has one job. When the parts are separate, it is much easier to find and fix a problem.
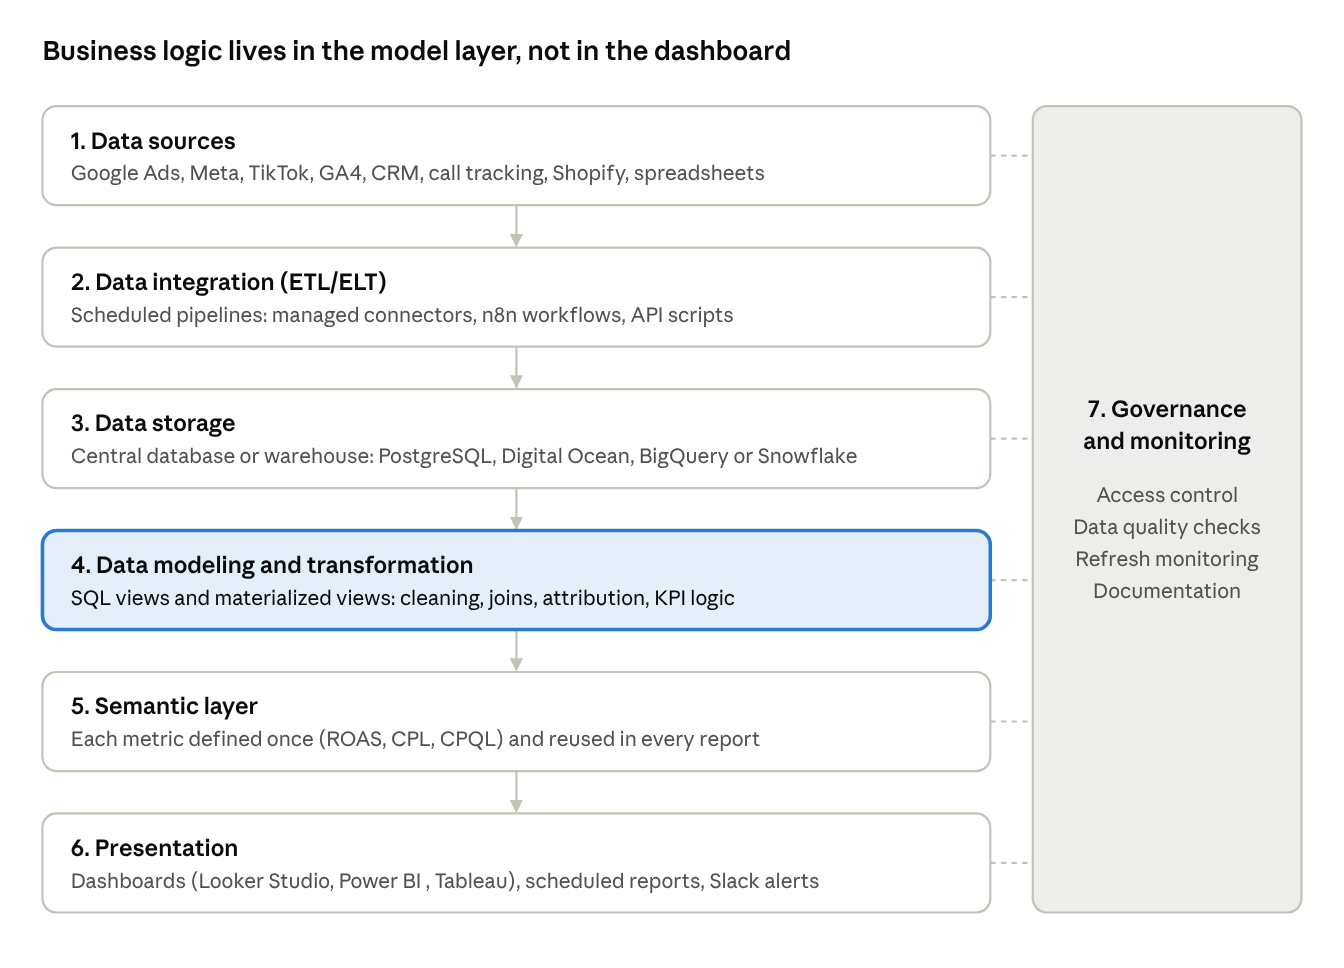
Data flows top to bottom; governance and monitoring cover every layer.
- Data sources. Everywhere the data is born: Google Ads, Meta, TikTok, GA4, Search Console, the CRM, call tracking, Shopify or Amazon, and spreadsheets with budgets and targets.
- Data integration. Pipelines that take data from each source on a schedule and load it into one place. In our team, the developer builds these with connectors, n8n workflows or scripts that call each platform’s API.
- Data storage. One central database. In our case it is PostgreSQL, with one schema per client. Raw data comes here first and stays untouched, so we can always go back and recalculate.
- Data modeling. This is where we spend most of our time, and where the real business logic lives. With SQL views and materialized views we clean campaign names, fix currencies, remove duplicate leads, join ad spend with CRM leads, apply the attribution rules and calculate the KPIs. This is the layer where the KPI dictionary from Step 3 becomes real code.
- Semantic layer. One place where each metric is defined once and reused everywhere, so ROAS or cost per qualified lead means the same thing in every report. For us, this is mostly shared views in the database that all dashboards read from.
- Presentation. What people actually see: dashboards in Looker Studio or Power BI, scheduled reports, and automatic alerts. For example, a daily Slack message that tells the team when cost per lead goes above the target, so nobody has to open a dashboard to notice it.
- Governance and monitoring. Access rights, data quality checks, refresh monitoring and documentation. This part goes across all the others and keeps the whole system trustworthy.
The biggest mistake we see is skipping layers 4 and 5 and putting all the logic directly in the dashboard tool. It works fine for the first report. By the tenth report, every dashboard calculates the same KPI a little bit differently, and nobody knows which number is right. We learned this the hard way, and now we keep as much logic as possible in SQL, not in the charts.
How to implement business intelligence: start small
When a company asks us how to implement business intelligence, we don’t start with a big, expensive project. We do it in small phases, where every phase ends with something people can use.
- Understand (first 1–2 weeks). Talk to the people who will use the reports. Agree on the goals and decisions, write the first version of the KPI dictionary, and list the data sources.
- Build the base (next 2–3 weeks). Set up the database, connect the two or three most important sources, and build the first data models. For example, only paid marketing: ad spend plus leads from the CRM.
- First real dashboard (next 2–3 weeks). One dashboard for one team. Check every number against the source platforms, show it to the users, and listen.
- Grow (the next 2–3 months). Add new sources and new reports one by one, always reusing the same models and the same KPI definitions. Add automatic alerts for the KPIs that need daily attention.
- Take care of it (always). Watch the refreshes and data quality, review the KPI definitions every few months, and remove reports that nobody opens.
These timelines are only an example. With messy data or many sources it takes longer, and that is normal.
A few things we always do
- Check every number against the source. Before we show a dashboard to anyone, we compare the totals with Google Ads, Meta or the CRM for the same dates. If there is a difference, we explain why: time zone, attribution window, currency or filters.
- Fix names in one place. Campaign and ad names are often wrong or inconsistent. The best is to fix them on the platform. When that is not possible, we keep the correction rules in one place in SQL, so every report gets the same fix.
- Write short notes. One short note per data model and per KPI. It saves hours later, when someone new joins the team or a client asks where a number comes from.
- Put the important thing on top. The main KPI and its target go first, compared with the previous period. Colors only for what needs action.
How we know the BI strategy is working
Not by the number of dashboards. More dashboards is not the goal. We look at simpler signals:
- People open the reports every week, without anyone reminding them.
- Fewer “why don’t the numbers match?” questions, and smaller differences from the source platforms.
- Less manual work. Fewer one-off exports and Excel reports for the analysts.
- Faster answers. A new business question gets an answer in hours or days, not weeks.
- Real decisions. The budget was moved, a campaign was paused, something changed because of what the data showed.
If people don’t use the reports, we don’t build new ones. First we go and talk to them.
Ready to take your marketing to the next level?
Let's chatFinal thoughts
We build dashboards every day, and the most important thing we learned is this: the dashboard is the easy part. The hard part is to agree what we want to know, what every number means, and to keep the data clean.
So if you are thinking about how to build a business intelligence strategy, don’t start with the tool. Start with one question. Define the KPIs and write them down. Keep the logic in the data model, not in the charts. Check every number against the source. And go step by step. When people see that one dashboard really helped them, they start asking for more by themselves. This is the moment when BI becomes part of the company, not just a project.
Thanks for reading. If you work with BI or data, we would be really happy to hear your opinion. What was the hardest part of building BI in your company?
Want dashboards your team actually opens? We help companies build their business intelligence step by step: clear KPI definitions, clean data from all your channels and CRM, and reports people trust. Book a free audit, and let’s look at your data together.

